SaaS application monitoring on autopilot
Automatic anomaly detection, endpoint health, end-to-end tracing, error monitoring and alerting, and background job monitoring out of the box. Connect your coding agent through MCP to investigate.
Detect anomalies in your running services.
Vigilon compares error rates, latency, and traffic with recent history and alerts you if an anomaly is detected.
Error rate spike detection
See when a service’s error rate rises above its usual level.
Latency regressions
See when an endpoint becomes slower than usual.
Traffic drops
Find unexpected drops in request traffic.
# 36 m ago
service   payments-api · prod
change    error rate 0.3% → 8.8%
window    last 30 m vs previous 24 h
deploy    v2.3.2 · near spike start
Evidence behind insights
Each finding shows what changed, where, and when.
Bring production context into your coding session.
Connect Vigilon to MCP clients. Your agent can inspect errors, traces, and endpoint health while it works in your repo.
vigilon · list_error_groups→ SignatureVerificationError · 87 eventsvigilon · get_trace 8dc4a12f→ exception in webhook.ts:84The failures all come from signature verification. Today’s deploy parses the request body before Stripe sees it, so the raw payload is gone. The change is in webhook.ts. Want me to patch it?
- 01
Add the server
Add the MCP server to your coding agent.claude mcp add --transport http vigilon https://mcp.vigilon.io/mcp - 02
Ask about production
Ask your agent to investigate a bug that showed up in production or dig into an insight about a regressing API endpoint. - 03
Ship the fix
Watch your agent do the work you normally would.
Send standard OpenTelemetry data.
Point any OTLP exporter at Vigilon. Run it beside your current backend. Keep your existing instrumentation.
It’s so easy to get started.
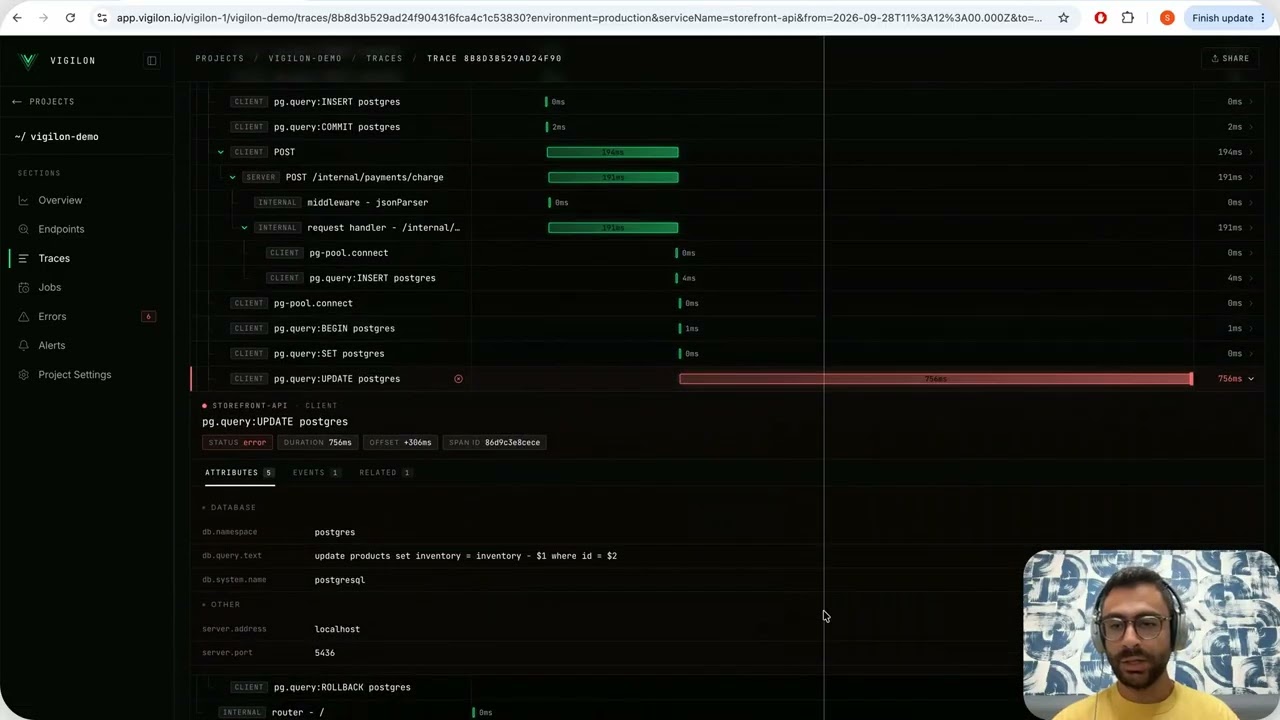
We recorded the flow from signup to live telemetry in one take, as proof.
- 01
Signup
Create your workspace and start your plan.
- 02
Create a project and API key
Name the project after your product, then generate an API key under its settings page.
- 03
Run the installer in your AI agent
Run `curl -fsSL https://vigilon.io/agents/install.md` and follow the instructions in that file to set up Vigilon in this project. - 04
Add your API key
VIGILON_API_KEY=[YOUR_API_KEY]
Join the early-access waitlist.
We’re looking for users who can use the product and give us feedback. Everyone on the waitlist gets 2 months of access to Vigilon for free.